![]()
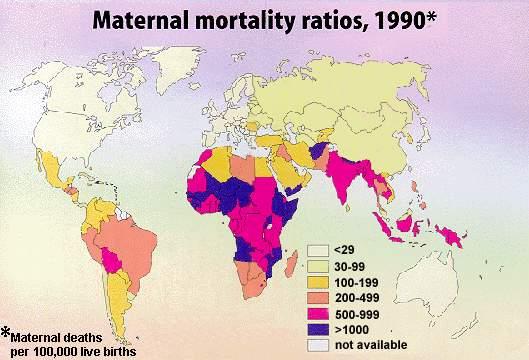
| ESTIMATES OF MATERNAL MORTALITY RATIOS WORLDWIDE |
Demographic and Socioeconomic Indicators for Sub-Saharan Africa |
||||||||||
| Country | 1997
Population (Millions) |
2025 |
Annual
Rate of Natural Increase (Percent) |
Average
Births Per Women (Total Fertility) |
Women
Using Contraception All/Modern Methods (Percent) |
Maternal
Deaths Per 100,000 Births |
Infant
Deaths Per 1,000 Live Births |
Literacy
Per 100 Adults 15 Years & Older Male/Female |
GNP
Per Capita ($US) |
Country
|
| Angola | 11.6 | 25.5 | 3.17 | 7.2 | na | 1,500 | 170 | 56 / 29 | 410 | Angola |
| Benin | 5.7 | 12.3 | 3.15 | 6.3 | 16 / 3 | 990 | 84 | 49 / 26 | 370 | Benin |
| Botswana | 1.5 | 2.6 | 2.62 | 4.9 | 33 / 32 | 250 | 40 | 81 / 60 | 3,020 | Botswana |
| Burkina Faso | 11.1 | 23.5 | 2.96 | 7.1 | 8/3 | 930 | 82 | 30 / 9 | 230 | Burkina Faso |
| Burundi | 6.4 | 12.3 | 2.63 | 6.8 | 8/31 | 1,300 | 106 | 49 / 23 | 160 | Burundi |
| Cameroon | 13.9 | 28.5 | 2.77 | 5.7 | 16 / 4 | 550 | 63 | 75 / 52 | 650 | Cameroon |
| Cape Verde | 0.4 | 0.7 | 2.51 | 3.9 | na | na | 54 | 81 / 64 | 960 | Cape Verde |
| Central African Republic | 3.4 | 6.0 | 2.22 | 5.3 | 15 / 3 | 700 | 103 | 69 / 52 | 340 | Central African Republic |
| Chad | 6.7 | 12.6 | 2.50 | 5.9 | na | 1,500 | 92 | 62 / 35 | 180 | Chad |
| Comoros | 0.7 | 1.3 | 3.15 | 6.0 | 21 / 11 | 950 | 83 | 64 / 50 | 470 | Comoros |
| Congo, Dem. Rep. | 48.0 | 105.9 | 3.35 | 6.7 | 8/1 | 870 | 128 | 87 / 68 | 120 | Congo, Dem. Rep. |
| Congo | 2.7 | 5.7 | 2.99 | 6.3 | na | 890 | 81 | 83 / 67 | 680 | Congo |
| Cote d'Ivoire | 14.3 | 24.4 | 2.58 | 5.7 | 11/3 | 810 | 90 | 50 / 30 | 660 | Cote d'Ivoire |
| Djibouti | 0.6 | 1.1 | 2.28 | 5.8 | na | 570 | 112 | 60 / 33 | na | Djibouti |
| Equatorial Guinea | 0.4 | 0.8 | 2.55 | 5.9 | na | 820 | 111 | 90 / 68 | 380 | Equatorial Guinea |
| Eritrea | 3.4 | 6.5 | 2.73 | 5.8 | 8/3 | 1,400 | 78 | na | 100 | Eritrea |
| Ethiopia | 60.1 | 136.3 | 3.08 | 7.0 | 4/2 | 1,400 | 113 | 46 / 25 | 100 | Ethiopia |
| Gabon | 1.1 | 2.1 | 2.00 | 5.0 | na | 500 | 87 | 74 / 53 | 3,490 | Gabon |
| Gambia | 1.2 | 2.0 | 2.41 | 5.6 | 12/6 | 1,100 | 78 | 53 / 25 | 320 | Gambia |
| Ghana | 18.3 | 36.3 | 2.87 | 5.7 | 20/10 | 740 | 70 | 76 / 54 | 390 | Ghana |
| Guinea | 7.6 | 15.3 | 3.03 | 7.0 | 1/31 | 1,600 | 130 | 50 / 22 | 550 | Guinea |
| Guinea-Bissau | 1.1 | 1.9 | 2.06 | 5.8 | na | 910 | 132 | 68 / 43 | 250 | Guinea-Bissau |
| Kenya | 28.4 | 50.2 | 2.59 | 5.4 | 33 / 27 | 650 | 61 | 86 / 70 | 280 | Kenya |
| Lesotho | 2.1 | 4.0 | 2.56 | 5.2 | 5/1 | 610 | 96 | 82 / 62 | 770 | Lesotho |
| Liberia | 2.5 | 6.6 | 2.12 | 6.8 | 6/5 | 560 | 157 | 54 / 22 | 450 | Liberia |
| Madagascar | 15.8 | 34.5 | 3.25 | 6.1 | 17 / 5 | 490 | 100 | 60 / 32 | 230 | Madagascar |
| Malawi | 10.1 | 20.4 | 2.82 | 7.2 | 22 / 14 | 560 | 137 | 72 / 42 | 170 | Malawi |
| Mali | 11.5 | 24.6 | 3.17 | 7.1 | 7/4 | 1,200 | 134 | 39 / 23 | 250 | Mali |
| Mauritania | 2.4 | 4.4 | 2.54 | 5.4 | 2/28 | 930 | 124 | 50 / 26 | 460 | Mauritania |
| Mauritius | 1.1 | 1.5 | 1.42 | 2.4 | 75 / 49 | 120 | 20 | 87 / 79 | 3,380 | Mauritius |
| Mozambique | 18.3 | 35.4 | 2.65 | 6.5 | na | 1,500 | 133 | 58 / 23 | 80 | Mozambique |
| Namibia | 1.6 | 3.0 | 2.56 | 5.3 | 29 / 26 | 370 | 60 | na | 2,000 | Namibia |
| Niger | 9.8 | 22.4 | 3.36 | 7.4 | 4/1 | 1,200 | 191 | 21 / 7 | 220 | Niger |
| Nigeria | 118.4 | 238.4 | 3.00 | 6.5 | 6/3 | 1,000 | 114 | 67 / 47 | 260 | Nigeria |
| Reunion | 0.7 | 0.9 | 1.61 | 2.4 | 67 / 62 | na | na | na | na | Reunion |
| Rwanda | 5.9 | 13.0 | -0.07 | 6.6 | 21 / 13 | 1,300 | 105 | 70 / 52 | 180 | Rwanda |
| Sao Tome & Principe | 0.1 | 0.2 | na | 6.4 | na | na | 62 | na | 350 | São Tome & Príncipe |
| Senegal | 8.8 | 16.9 | 2.70 | 6.1 | 13 / 8 | 1,200 | 74 | 43 / 23 | 600 | Senegal |
| Seychelles | 0.1 | 0.1 | na | 2.7 | na | na | 15 | na | 6,620 | Seychelles |
| Sierra Leone | 4.4 | 8.2 | 1.94 | 6.5 | na | 1,800 | 164 | 45 / 18 | 180 | Sierra Leone |
| Somalia | 10.2 | 23.7 | 3.17 | 7.0 | na | 1,600 | 125 | na | 120 | Somalia |
| South Africa | 43.3 | 71.6 | 2.24 | 4.1 | 50 / 48 | 230 | 50 | 82 / 82 | 3,160 | South Africa |
| Sudan | 27.9 | 46.9 | 2.09 | 5.0 | 9/5 | 660 | 73 | 58 / 35 | 480 | Sudan |
| Swaziland | 0.9 | 1.7 | 2.81 | 4.9 | 20 / 17 | 560 | 68 | 78 / 76 | 1,170 | Swaziland |
| Tanzania | 31.5 | 62.4 | 2.88 | 5.9 | 18 / 13 | 770 | 93 | 79 / 57 | 120 | Tanzania |
| Togo | 4.3 | 8.8 | 2.95 | 6.6 | 12/2 | 640 | 78 | 67 / 37 | 310 | Togo |
| Uganda | 20.8 | 45.0 | 2.90 | 7.1 | 15 / 8 | 1,200 | 88 | 74 / 50 | 240 | Uganda |
| Zambia | 8.5 | 16.2 | 2.63 | 6.0 | 26 / 14 | 940 | 112 | 86 / 71 | 400 | Zambia |
| Zimbabwe | 11.7 | 19.3 | 2.68 | 4.3 | 48 / 42 | 570 | 49 | 90 / 80 | 540 | Zimbabwe |
| Sub-Saharan Africa | 621.6 | 1,244.0 | 2.80 | 6.1 | 18 / 12 | 980 | 105 |
67 / 47
|
490 |
Sub-Saharan
Africa
|
| Sources: 1997 and 2025 population size, rate of natural increase (1990-1995), and average births per woman (1990-1995): United Nations. World Population Prospects: The 1996 Revision. New York: United Nations, 1996; contraceptive prevalence: United Nations. Levels and Trends of Contraceptive Use as Assessed in 1994. New York: United Nations, 1996 and most recent Demographic and Health Surveys data; maternal mortality: WHO and UNICEF. Revised 1990 Estimates of Maternal Mortality. A New Approach by WHO and UNICEF. WHO, 1996; infant mortality: UNICEF. The State of the World's Children 1998. New York: Oxford Univ. Press, 1998; literacy: UNESCO. 1997 Statistical Yearbook. Paris and Lanham, MD: UNESCO and Bernan Press, 1997; GNP per capita: World Bank. World Development Report 1997 and World Development Indicators 1997. Washington, DC: World Bank, 1997 | ||||||||||
Africa's
Population Challenge: Accelerating Progress in Reproductive Health
Table
of Contents
Download this in pdf-format
Population Action International Homepage
![]()
![]() Download this page in pdf-format
Download this page in pdf-format